See what your creator program is actually worth.
.avif)
Numbers that finally add up to something.
Every piece of content gets a dollar value, so program spend is always weighed against what it actually produced.
Trend comparisons adjust to your date range, so you're always measuring the right periods when you pull a report.
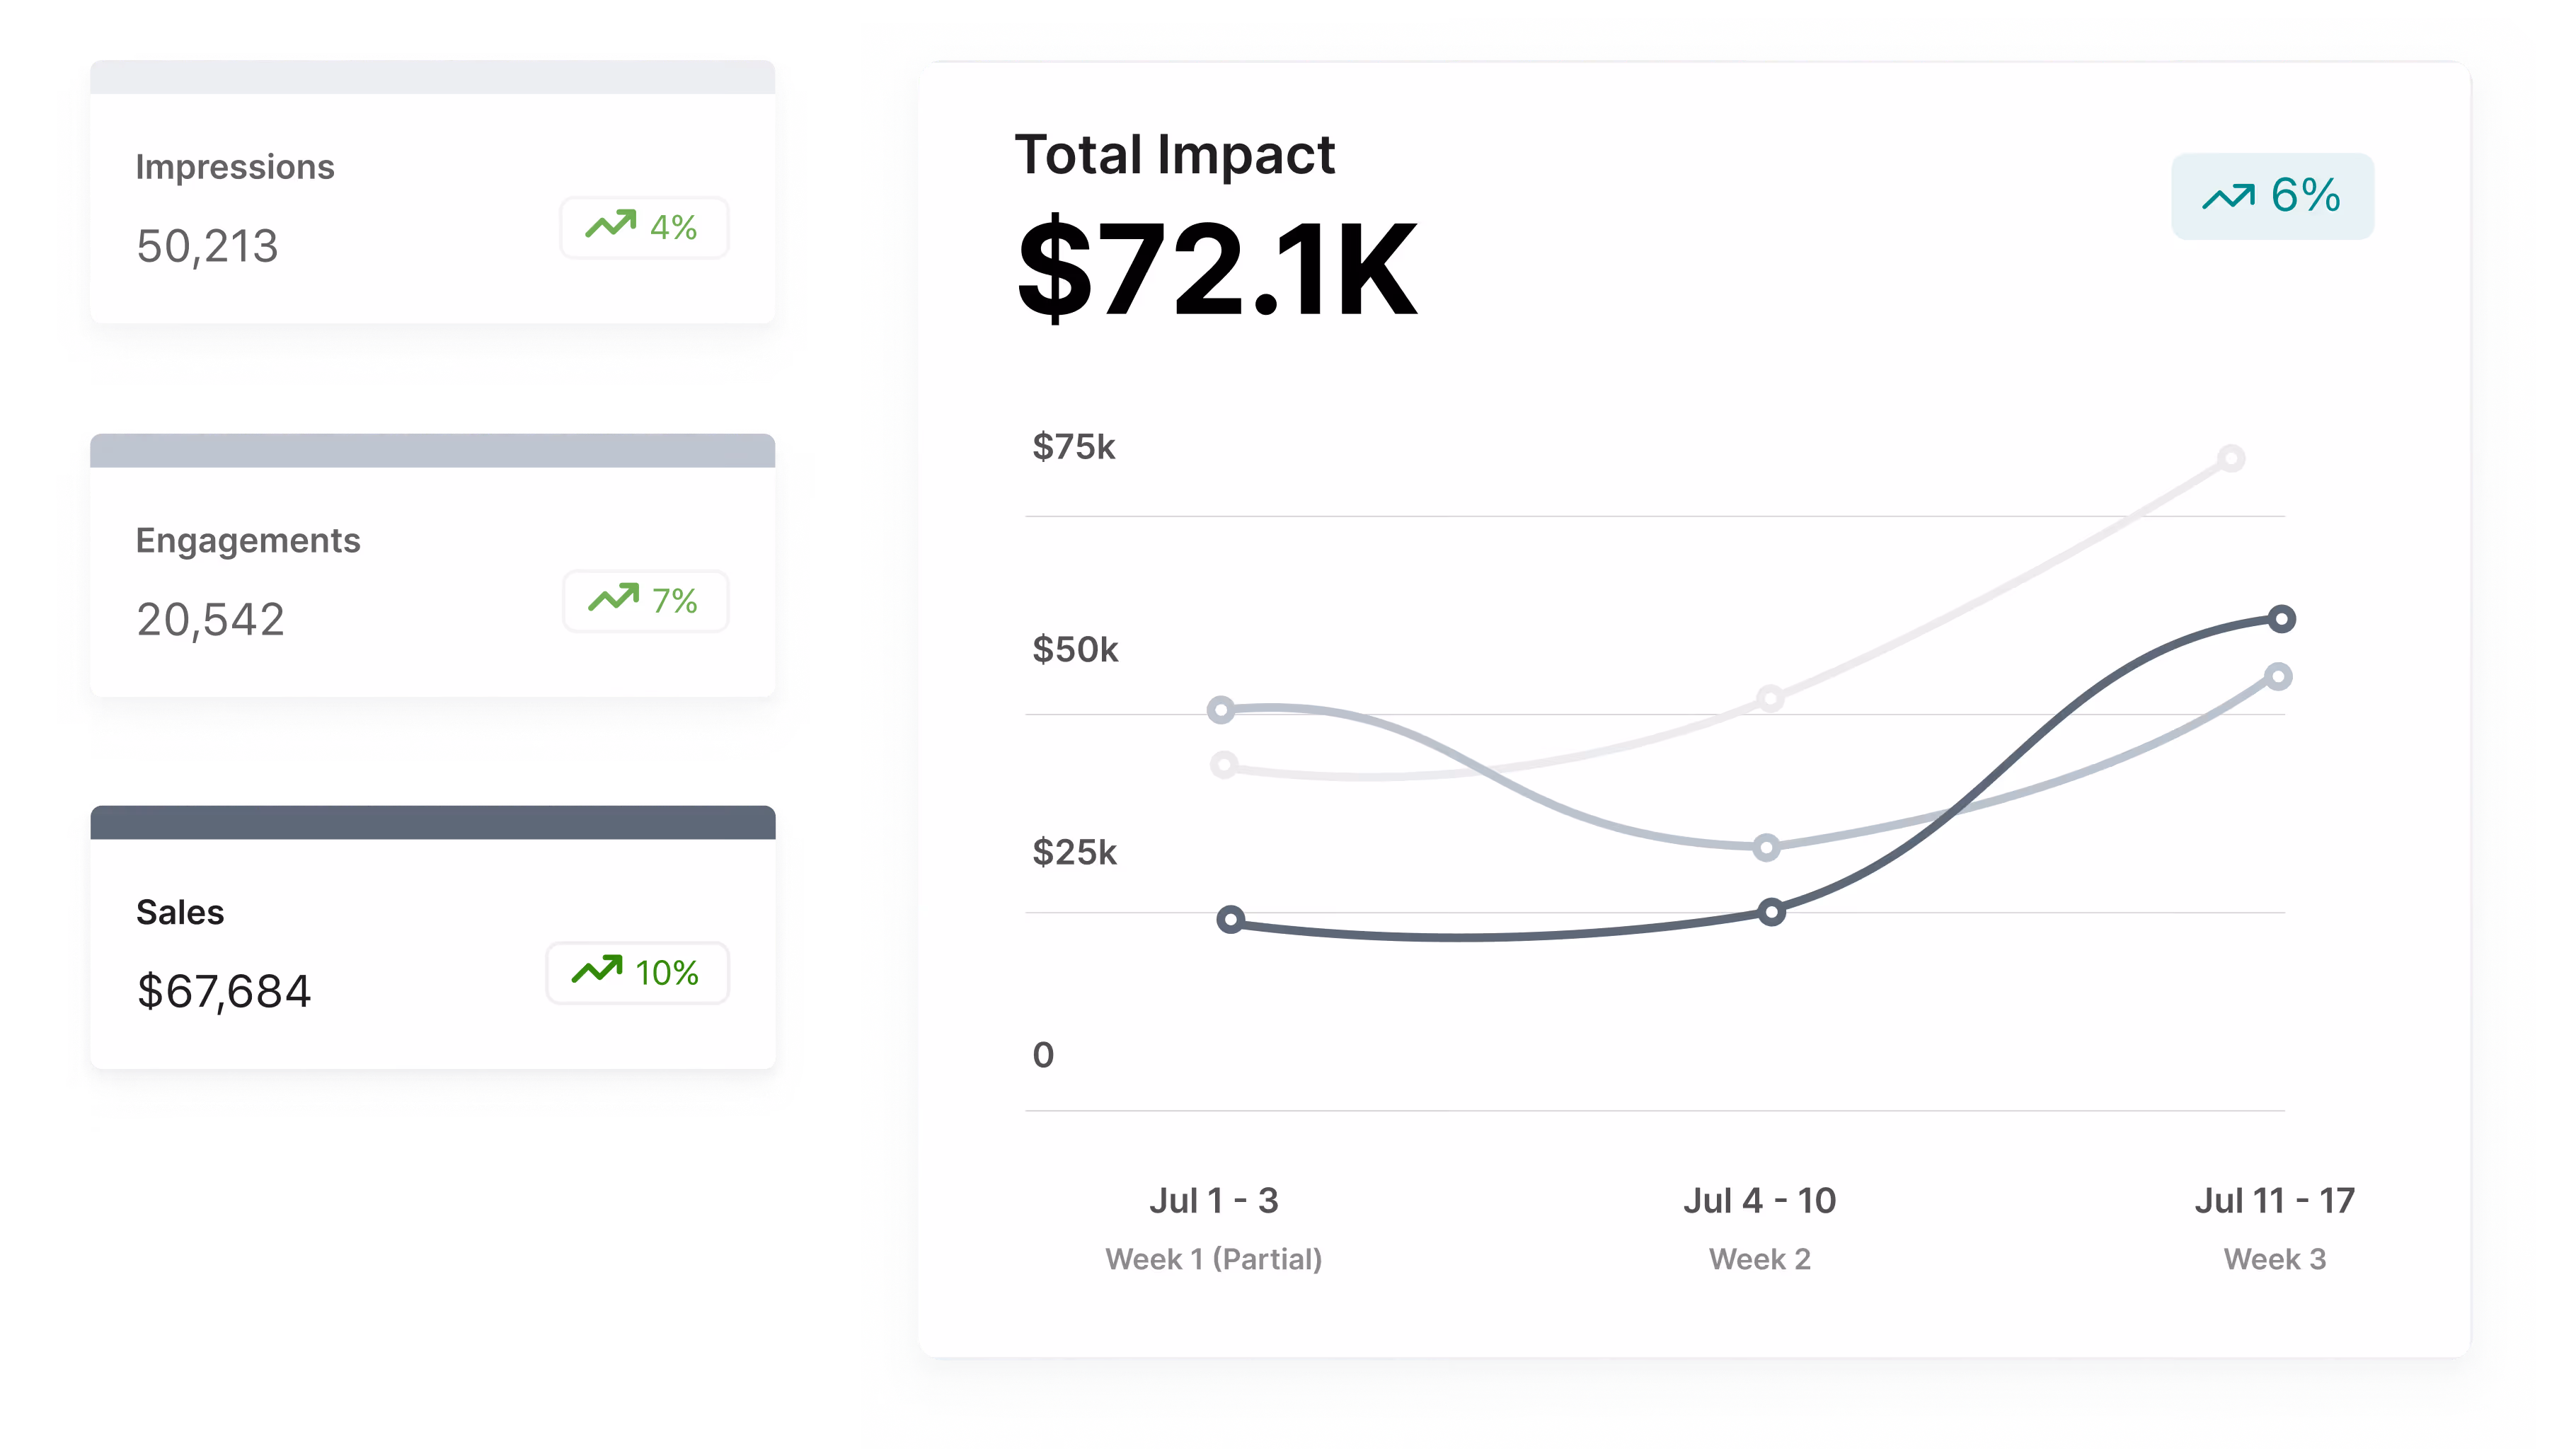
Content, reach, engagement, and sales roll up into one score, so the full picture is never more than a click away.
Creator programs generate value that most reporting tools were never built to capture. A short video doesn't just drive clicks the week it goes live. It produces licensed content your brand can use, awareness that reaches audiences paid media can't touch, and engagement that signals real cultural relevance. The problem has never been that creator programs don't work. It's that the tools brands use to measure them only tell part of the story, which makes it easy for skeptics to undercount the return.
Impact Dashboard was built to close that gap. It assigns a dollar value to every piece of content, every impression, every like, comment, and click, and every sale tracked through Aspire, then weighs all of it against what the program actually cost to run. The result is a single Impact Value score that reflects what your creator program is genuinely worth, not just what it drove to checkout.
How to use
Getting started with Impact Dashboard requires no setup, no configuration, and no waiting. The moment you log into Aspire, the Performance Impact Snapshot on your homepage is already populated with six months of data across all four value funnels: content, impressions, engagement, and sales. It updates automatically and shows month-over-month trends so you always have a current read on program health without pulling a single report.
When you need more detail, the full Impact Dashboard lives in the Reporting tab. From there, you can filter by date range, compare periods, and break down performance by funnel. The date filters are flexible: run it by week, month, quarter, or year to date, and the trend data recalculates to match whatever window you set. If you want to narrow results to a specific campaign, project-level filtering is available there too. The whole experience is designed to get you to a defensible number fast, whether you're prepping for a budget review or just doing a routine check-in on how the program is tracking.
Two views, one picture.
The Impact Dashboard works across two surfaces: a quick snapshot on your homepage and a full breakdown in Reporting. Together, they cover both the at-a-glance check-in and the deep dive.
Performance Impact Snapshot
A live homepage view of your last six months, with month-over-month trends across content, impressions, engagement, and sales.
Impact Value Score
A single calculated score that weighs total content, awareness, engagement, and sales value against what your program cost to run.