Every metric that matters, in one place.
The full picture, without the digging.
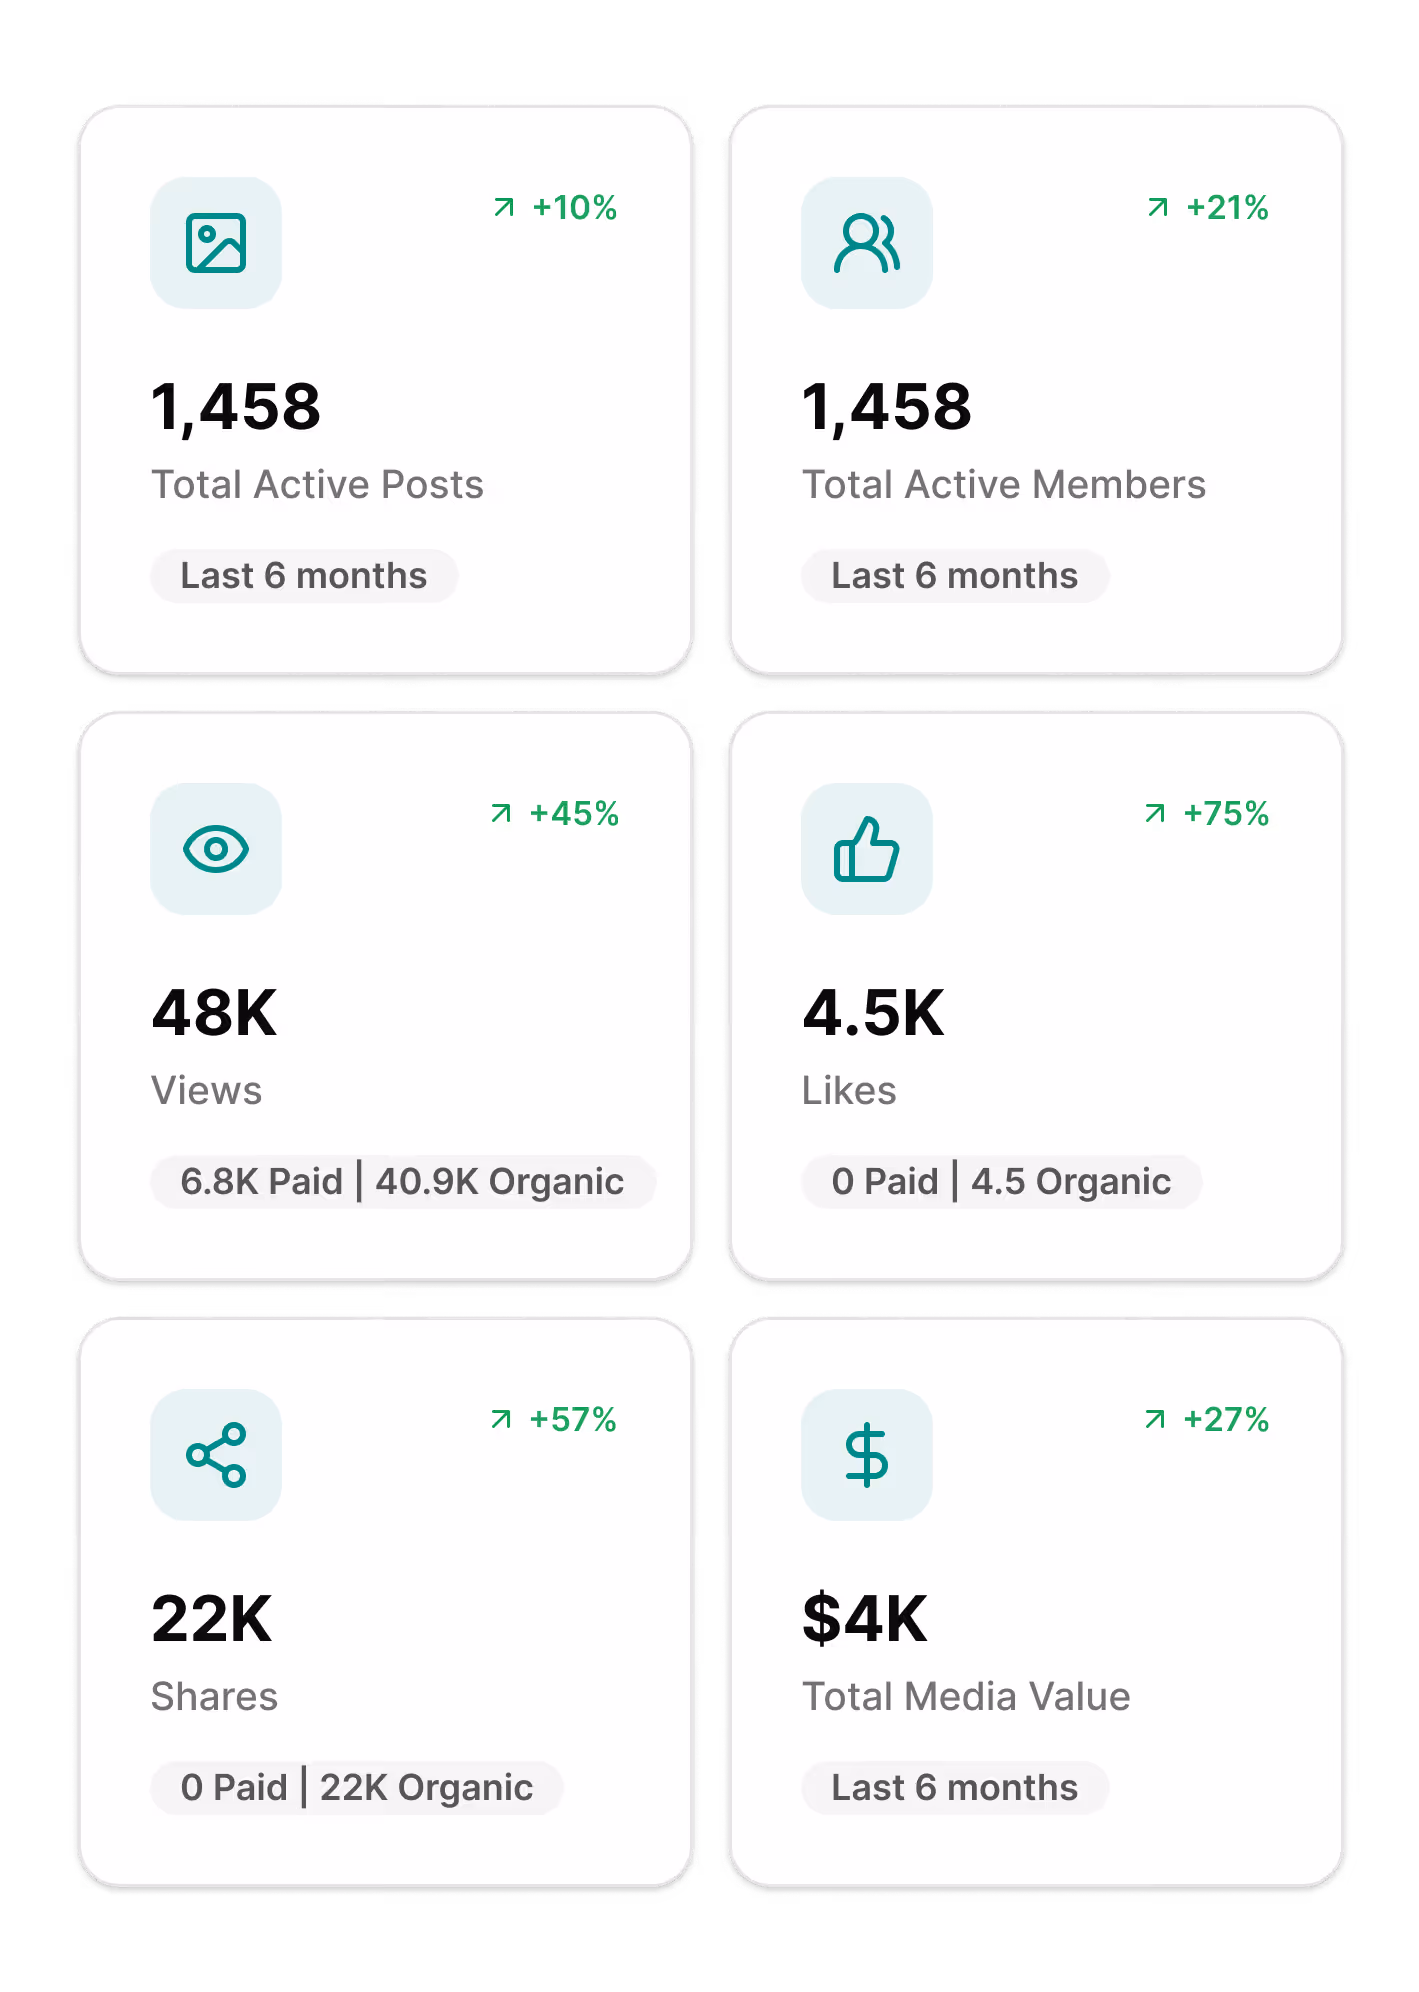
See awareness & engagament metrics rolled up across your whole program with advanced filters to refine results.
Break performance down by individual creator to see who's driving results and how your roster distributes across tiers.
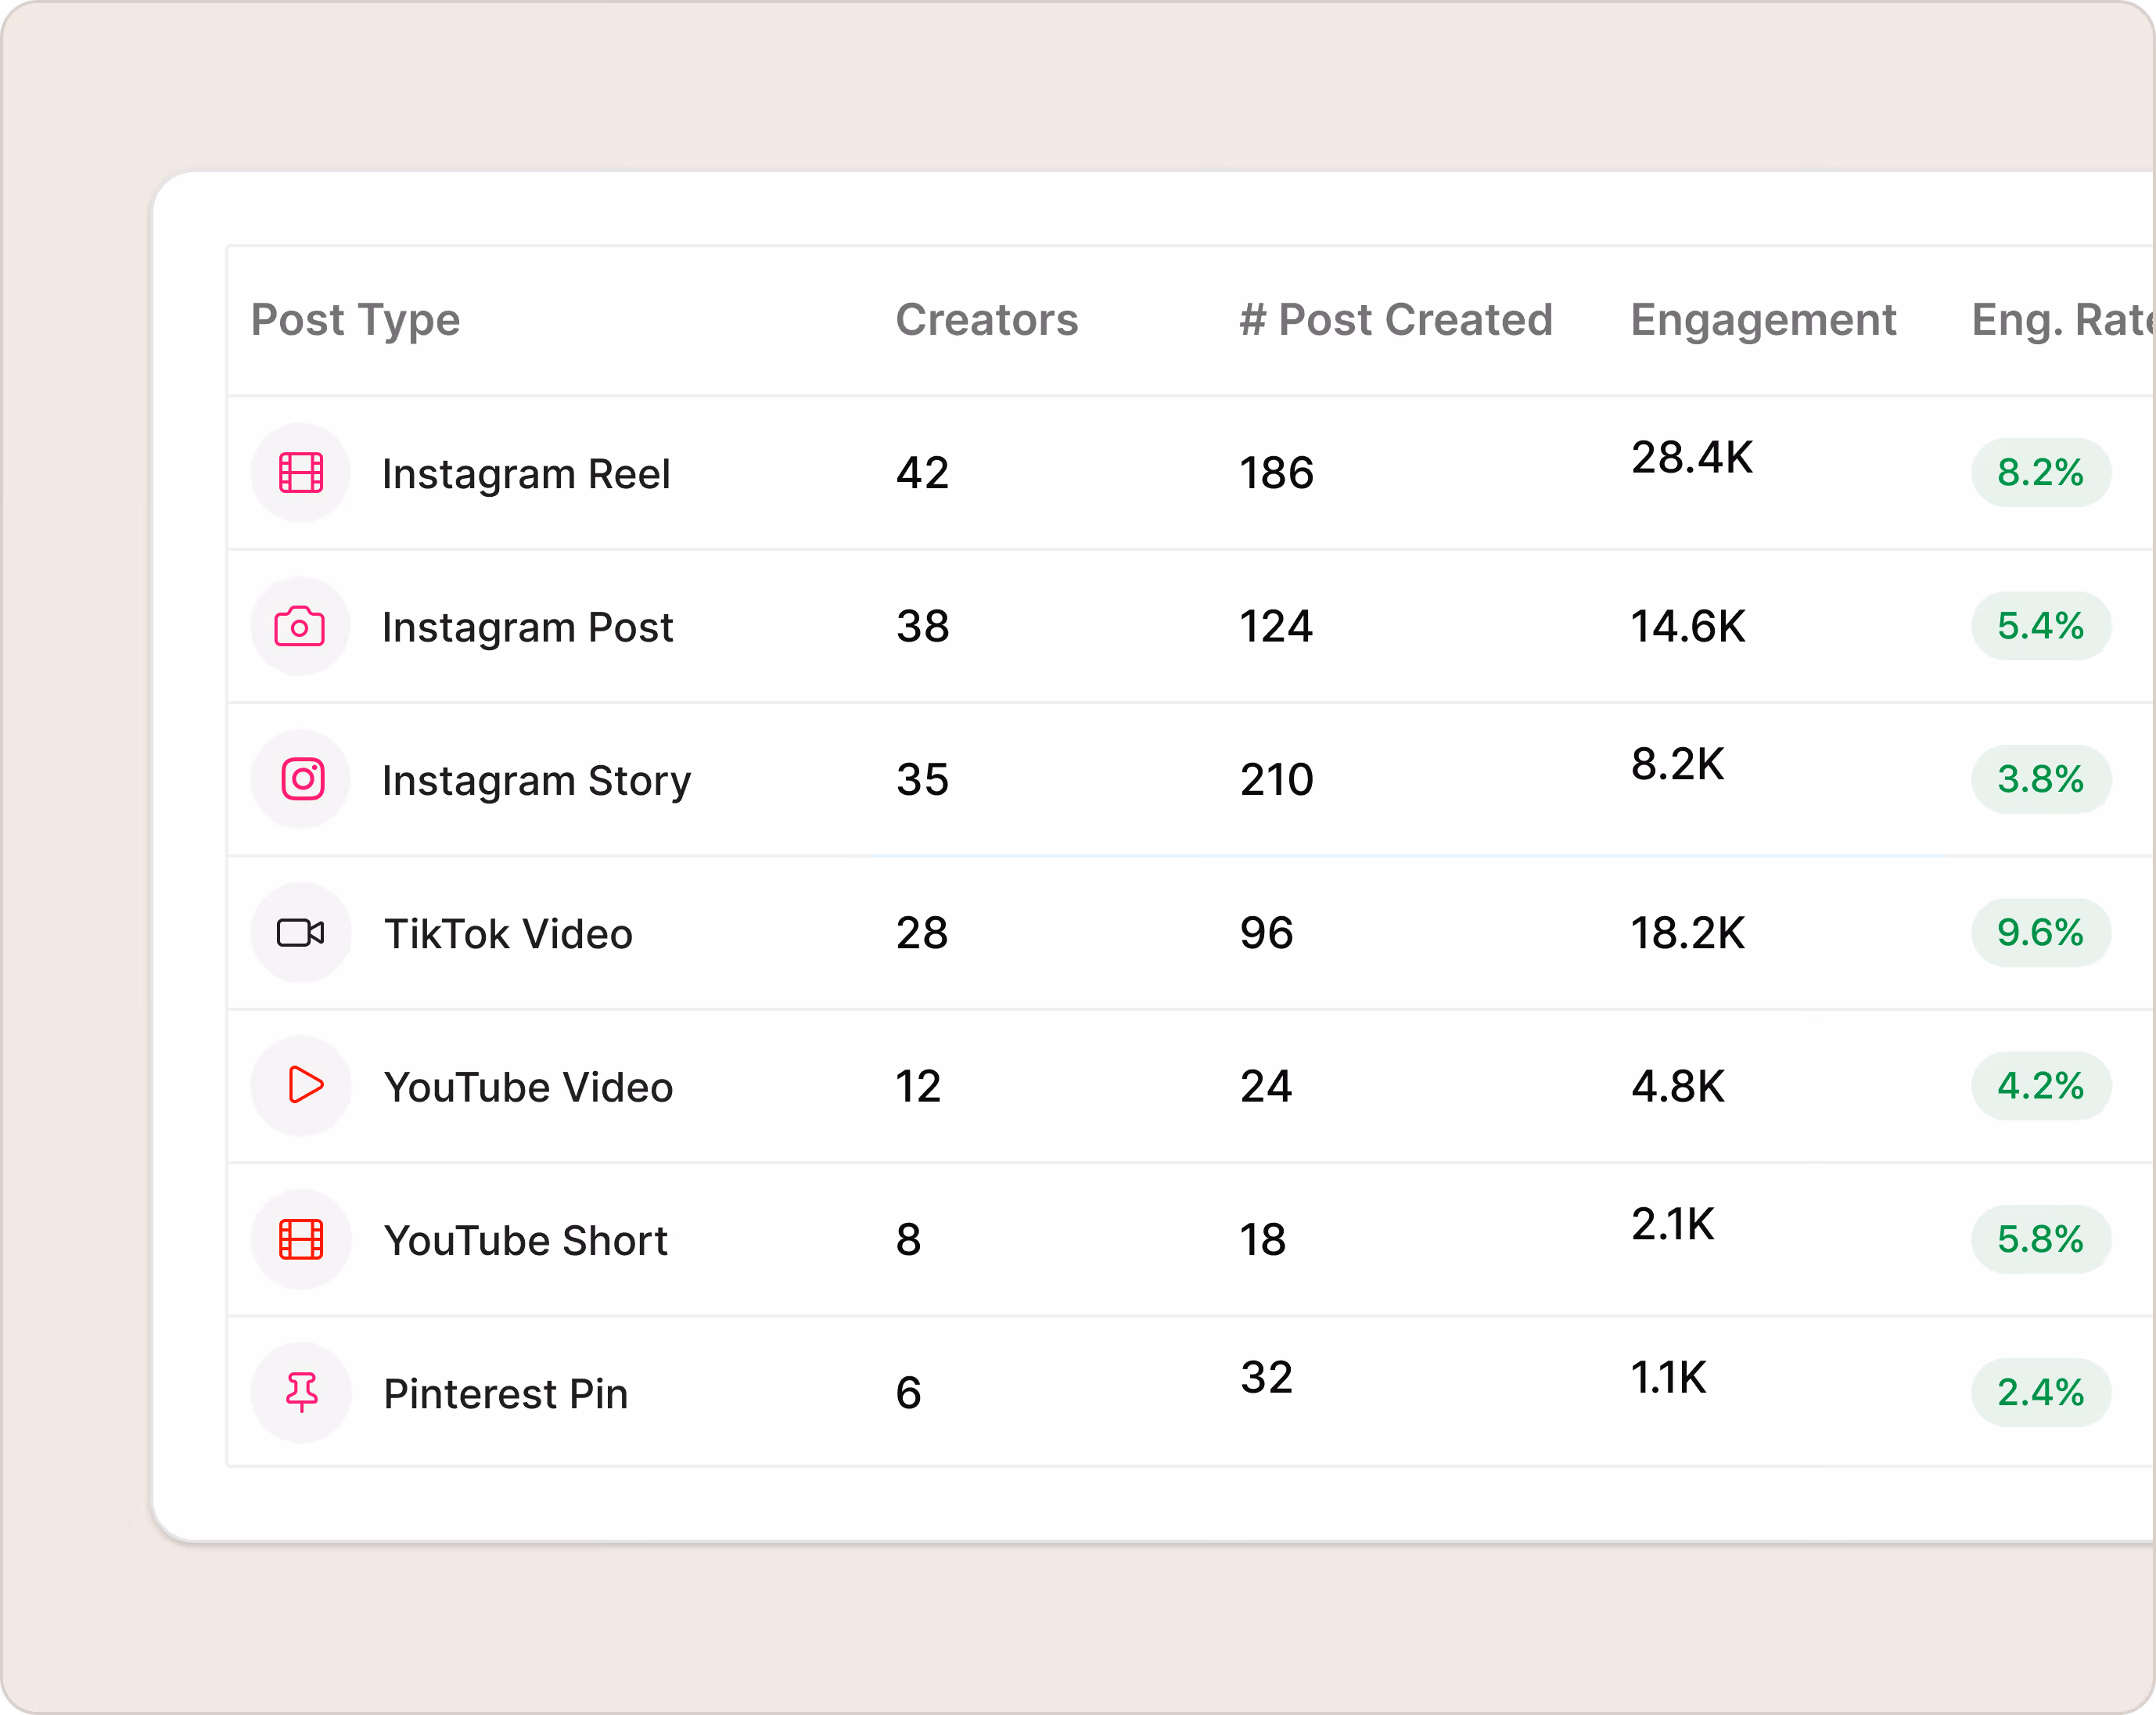
See which networks are pulling their weight and which post types are performing best on each one.
Social Dashboard pulls reach, impressions, engagement, and Total Media Value into one place, cut by post, creator, or platform, so you're not assembling a spreadsheet every time you need an answer. Trend arrows show how each metric compares to the previous period. Drill into the Posts tab to scan content as thumbnails or sort it in a table. Check the Members tab to see which creators are driving the most impact and how your roster breaks down across tiers. Pull up Networks to compare performance by platform and post type. Everything's there. Pick the tab that matches your question.
How to use
Social Dashboard is built to get you to an answer fast. Land on the Summary tab for a program-wide snapshot, use the filters to zero in on exactly what you need, then move across tabs as your questions get more specific. Whether you're prepping for a quarterly review or trying to figure out which creator tier is carrying your TikTok numbers, it's a few clicks away.
Two ways to see your content.
The Posts tab gives you the same data in two formats. Pick the one that fits how you think.
Card View
Browse posts as thumbnails sorted by date, then click into any one to see full performance details, project tags, and a link to the live post.
Table View
Sort and reorganize post metrics in columns so you can rank performance however is most useful to you.