Measuring Influencer Marketing: Essential Metrics & ROI Steps

Measure influencer marketing with essential metrics, ROI formulas, attribution methods, tracking tips, and dashboards that turn creator data into growth.
TL;DR
- Start with the business outcome, then set one primary KPI and a short list of diagnostic metrics that explain performance.
- Track influencer campaign results across awareness, engagement, traffic, conversions, revenue, and retention.
- Use layered influencer marketing attribution. Combine UTMs, affiliate links, promo codes, pixels, and post-purchase surveys to reduce blind spots.
- Calculate ROI with total campaign costs, including creator compensation, products, shipping, paid media, tools, and material internal costs.
- Put creator, content, paid-media, ecommerce, and CRM data in one reporting view so your team can make decisions while a campaign is still active.
Influencer marketing ROI formula:
ROI = ((Revenue − Total Campaign Costs) ÷ Total Campaign Costs) × 100
Platform dashboards make impressions, views, and likes easy to collect. Those numbers do not explain whether creator activity drove the business result your team needed, whether that was product awareness, qualified traffic, purchases, or repeat customers.
Useful influencer marketing metrics connect content performance to a defined campaign objective. The work starts before a creator receives a brief. Set goals, choose KPIs, build tracking, calculate ROI, unify reporting, and use the findings to adjust spend. No single attribution method captures every customer journey, so credible reporting combines several data sources.
Why Influencer Measurement Starts With Your Goals
Metrics only matter when they answer a business question. A campaign built to introduce a new product should not use last-click revenue as its primary success measure. A campaign built to acquire customers needs more than reach and engagement screenshots.
Before launch, document:
- The campaign objective
- The target audience and desired action
- One primary KPI that determines success
- Supporting diagnostic metrics
- A target threshold or benchmark
- The tracking methods and reporting owner
Take a goal-first approach. Measurement should match the value a campaign is meant to create.
Awareness vs. Consideration vs. Conversion Goals
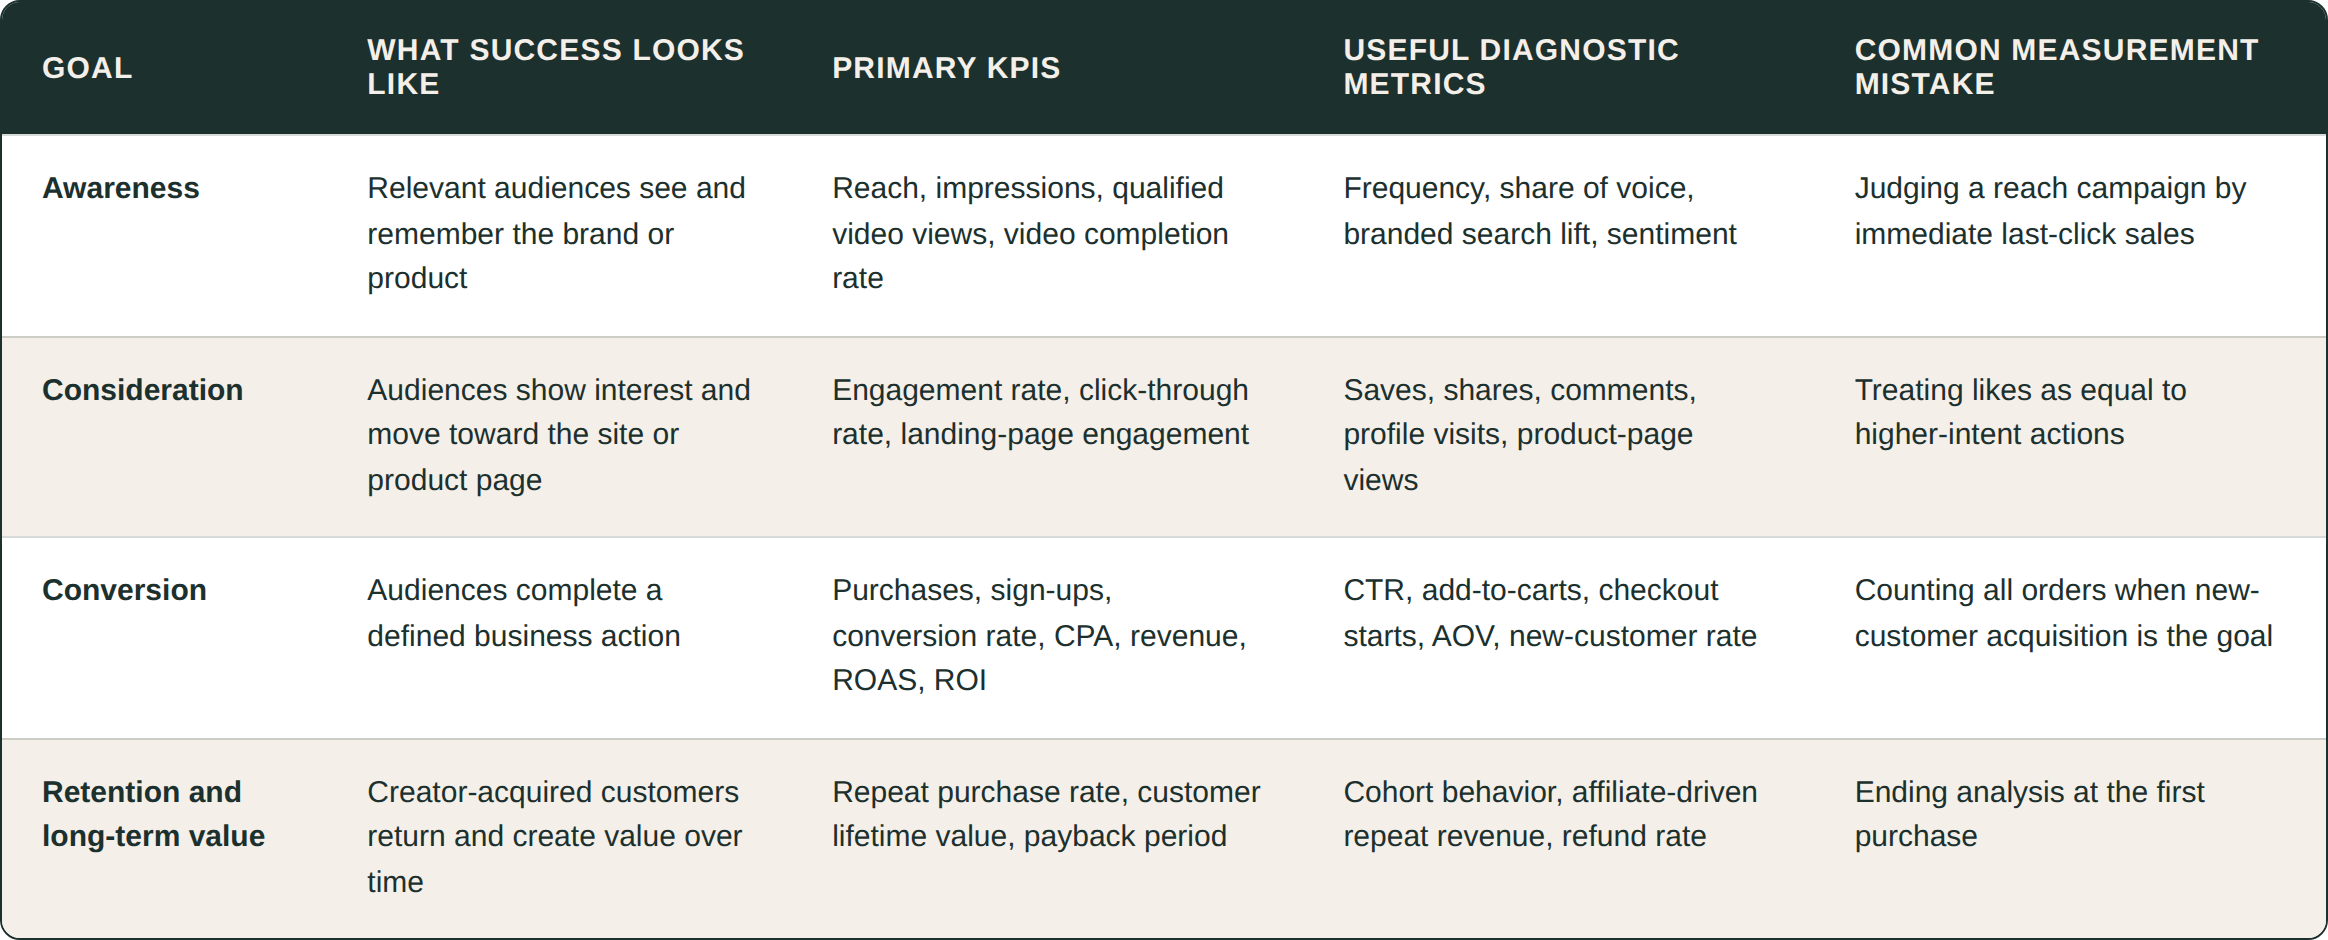
Upper-funnel creator content can influence sales after the campaign window closes. A viewer may discover a product through a creator, return later through search, email, or retargeting, and buy through another channel. Report this behavior alongside direct-response results instead of forcing every campaign into a last-click model.
Primary vs. Diagnostic KPIs
A primary KPI is the single metric used to judge whether a campaign met its objective.
Diagnostic KPIs explain why the campaign did or did not reach that result. They point to the part of the customer journey that needs attention.
For example:
- For a sales campaign, conversion rate or CPA may be the primary KPI. CTR, landing-page bounce rate, and average order value help diagnose the result.
- For an awareness campaign, qualified reach or completed video views may be the primary KPI. Frequency, engagement quality, and sentiment provide context.
- For a product launch, branded search lift may be a useful supporting indicator alongside reach and completed views.
A report with dozens of unranked metrics creates noise. Give leadership a primary KPI, then show the metrics that explain performance and support the next decision.
How to Set Decision Thresholds Before Launch
Put performance thresholds in the campaign brief before content goes live. This protects the team from rewriting the definition of success after results arrive.
Build targets from:
- Historical campaign data.
- Performance by creator tier, platform, audience, and content format.
- Paid social and affiliate benchmarks.
- Product margins and allowable acquisition cost.
- Past landing-page and offer performance.
Use thresholds to define actions:
- Scale creators or content formats that exceed your target ROAS or CPA.
- Refresh creative, offers, or landing pages when CTR is healthy but conversion is weak.
- Pause or renegotiate partnerships that fall below minimum quality and efficiency standards.
- Test new creator segments when a campaign reaches the target but lacks enough volume.
Treat benchmarks as directional. A creator’s audience, platform, content format, product category, and offer all affect outcomes. Compare like with like instead of applying one target across every partnership.
The Influencer Marketing Metrics That Actually Matter
This section is a full-funnel reference for selecting influencer campaign performance metrics. Report the measures that align with your goal. Every available metric does not need a place in the executive summary.
Formula Reference
Awareness Metrics
Awareness metrics show how many people had the opportunity to see the content and how they responded to it.
- Reach: The number of unique accounts exposed to content.
- Impressions: Total content displays. Compare impressions with reach to understand frequency.
- Video views: A count of views based on the platform’s definition. Confirm the view threshold before comparing platforms.
- Video completion rate: Completed views divided by video starts or views, based on the platform methodology.
- Share of voice: Brand mentions or creator conversation volume relative to competitors or category discussion.
- Branded search lift: Changes in branded-search demand during and after the campaign.
- Sentiment: The balance of positive, neutral, and negative audience response.
Awareness data is more useful when paired with a review of content quality, creator-audience fit, and comment themes. A large reach number has limited value if the audience is outside the campaign’s intended customer group.
Engagement Metrics
Engagement indicates that an audience acted on a creator post. The action matters.
Lower-intent signals include likes and reactions. Comments can show attention, but comment quality provides more context than comment volume alone. Saves, shares, story replies, direct messages, profile visits, and link interactions can signal stronger interest where platforms make those metrics available.
Two common influencer engagement rate formulas are:
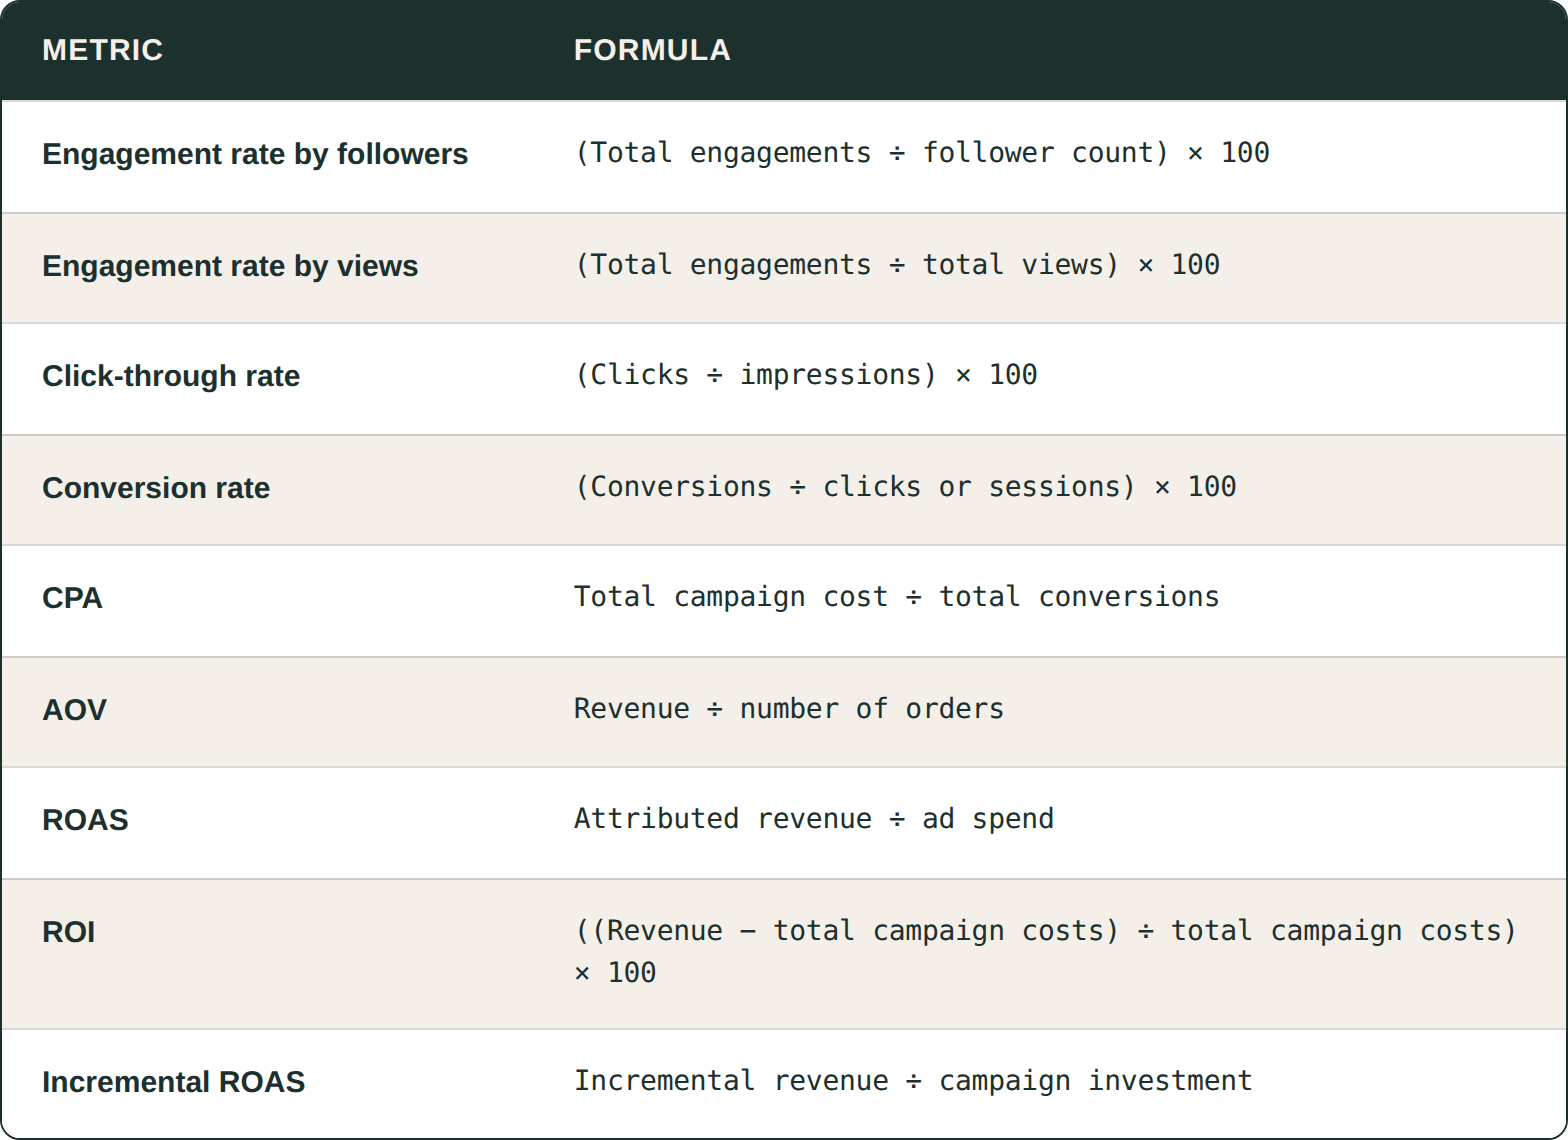
Engagement rate by followers = (Total engagements ÷ follower count) × 100
Engagement rate by views = (Total engagements ÷ total views) × 100
Engagement rate by views is often more useful for short-form video because video reach can vary widely from one post to another. A follower-based calculation can hide whether viewers who received the content chose to interact with it.
Engagement volume and engagement quality are separate measures. A smaller creator may generate fewer total interactions while bringing in more qualified traffic, stronger comments, or more sales. We recommend aligning measures with campaign goals and evaluating qualitative signals alongside performance data.
Traffic Metrics
Traffic metrics connect creator content to onsite behavior.
Track:
- Clicks and unique clicks
- Click-through rate
- Sessions and engaged sessions
- New users
- Landing-page engagement time
- Bounce rate or engagement rate, based on your analytics setup
- Product-page views
- Add-to-carts
- Checkout starts
CTR = (Clicks ÷ Impressions) × 100
Use traffic data to find friction:
- Strong views with weak CTR can point to a weak call to action, unclear product value, or an inaccessible link.
- Strong CTR with weak conversion rate can indicate a mismatch between creator messaging and the landing page.
- High conversion rates from low traffic can identify a highly qualified creator audience worth expanding.
Conversion Metrics
Conversion metrics show whether the campaign generated a defined action. The event depends on the program: purchases, leads, registrations, app installs, subscriptions, or another business outcome.
Key measures include:
- Total conversions
- Conversion rate
- Cost per acquisition or customer acquisition cost
- New-customer rate
- Average order value
- Refund or cancellation rate, where relevant
Conversion rate = (Conversions ÷ Clicks or sessions) × 100
CPA = Total campaign cost ÷ Total conversions
AOV = Revenue ÷ Number of orders
Choose one conversion-rate denominator and use it consistently. A conversion rate based on clicks cannot be directly compared with one based on sessions unless the reporting clearly separates them.
When customer acquisition is the objective, separate new-customer orders from total orders. Repeat customers can be valuable, but they answer a different question.
Revenue and ROI Metrics
Revenue, ROAS, ROI, and incremental ROAS each answer different questions.
- Revenue: Sales attributed to a campaign
- ROAS: Revenue efficiency, usually expressed as revenue divided by paid spend
- ROI: Profitability after all campaign costs are included
- Incremental ROAS: Revenue that would not have happened without the campaign, divided by investment
ROAS = Attributed revenue ÷ Ad spend
ROI = ((Revenue − Total campaign costs) ÷ Total campaign costs) × 100
Incremental ROAS = Incremental revenue ÷ Campaign investment
ROAS should not be presented as ROI. ROAS shows revenue efficiency against ad spend. ROI includes the broader investment and indicates whether the program produced a return after costs.
For a detailed view of ROI, ROAS, customer acquisition, and related calculations, see Aspire’s influencer ROI formula guide.
Brand Health Metrics
Brand health metrics matter most for awareness, category-entry, and product-launch campaigns. They include:
- Branded search volume
- Brand mentions
- Share of voice
- Sentiment
- Brand lift and recall studies
- Audience growth and the quality of followers gained
- Creator-generated content volume
- Reusable content asset value
Earned media value, or EMV, estimates what comparable exposure or engagement might cost through paid media. It can support directional comparisons and awareness reporting. It should not replace revenue, profit, ROI, or incremental-impact measurement when business impact is the goal.
How to Calculate Influencer Marketing ROI
A credible influencer marketing ROI formula includes every material campaign cost. Counting only a creator’s flat fee can make a program appear more profitable than it is.
Follow a simple process:
- Define the return you will measure, such as attributed revenue or gross profit.
- Calculate total campaign investment.
- Apply the formula.
- Compare the result with campaign goals, acquisition cost limits, and margins.
- Review the outcome by creator, format, audience, and paid-media investment.
The Influencer Marketing ROI Formula (and What Most Brands Get Wrong)
Influencer Marketing ROI = ((Attributed Revenue − Total Campaign Costs) ÷ Total Campaign Costs) × 100
Total campaign costs can include:
- Creator fees, commissions, performance bonuses, and agency fees
- Product seeding, samples, fulfillment, and shipping
- Content production, editing, legal review, and usage rights
- Paid amplification, whitelisting, or partnership-ad spend
- Influencer platform, tracking, and reporting costs
- Internal labor and campaign-management overhead when material to the investment decision
For a low-margin business, gross profit may be a better return input than revenue. Revenue can show top-line performance while masking a campaign that does not recover product, fulfillment, and acquisition costs.
Aspire’s framework for accurate influencer ROI measurement explains why teams should define their investment and tracking approach before they calculate returns.
ROAS vs. ROI vs. Incremental ROAS
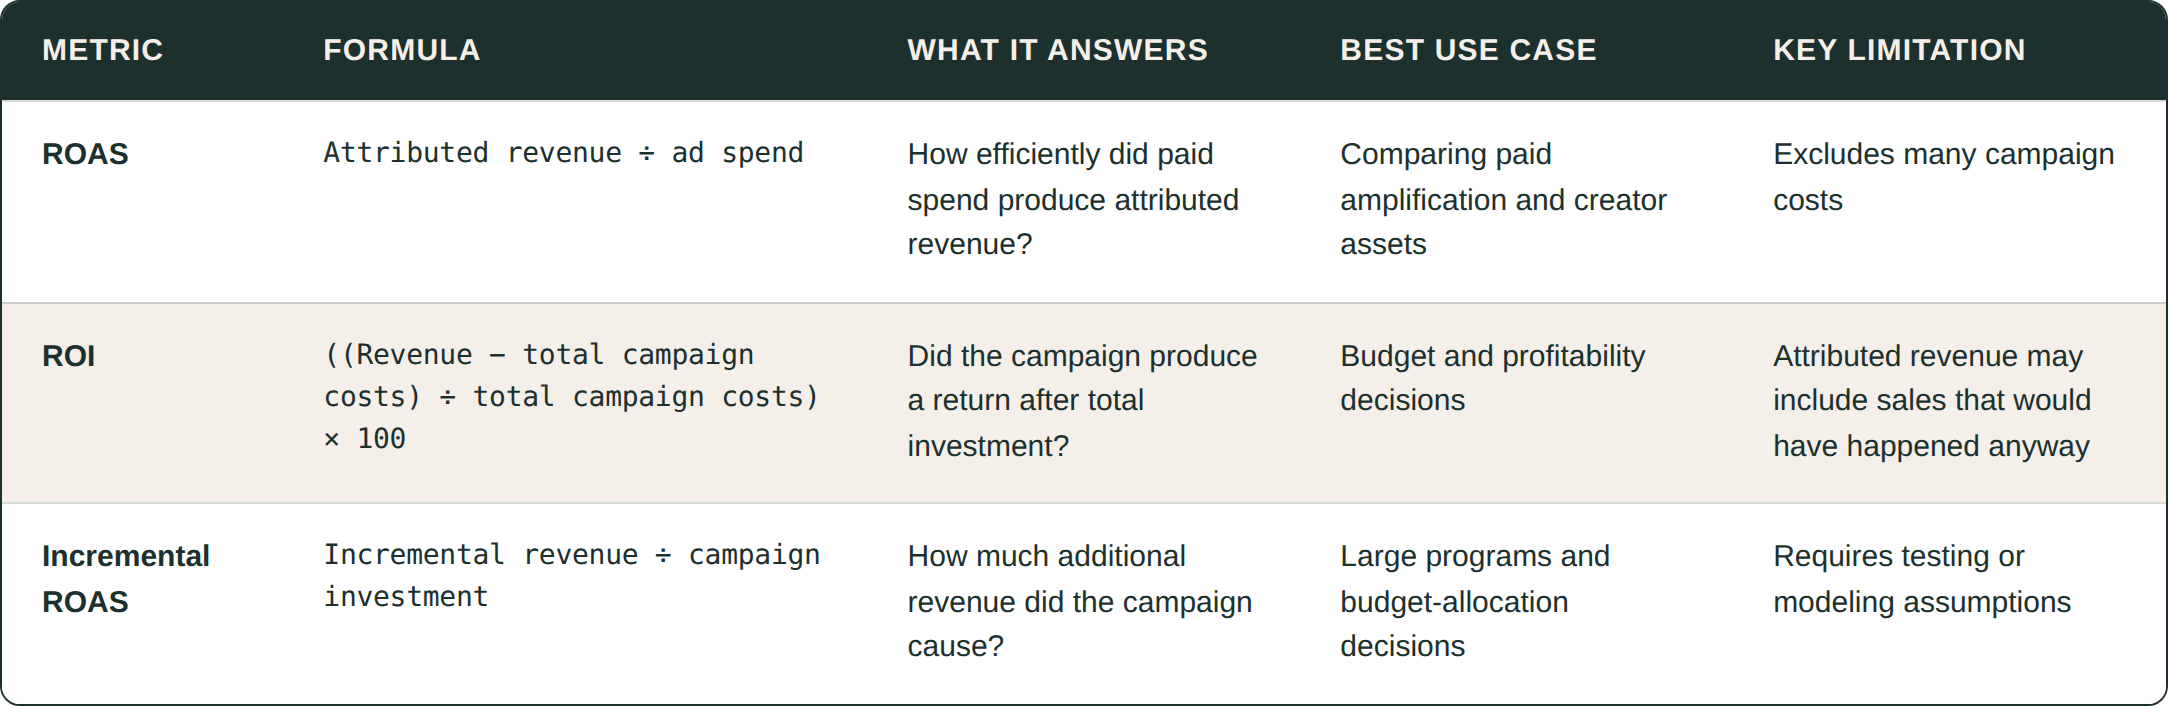
Use ROAS to compare revenue efficiency across creator content and paid amplification. Use ROI to evaluate profitability. Use iROAS or incrementality testing to estimate causal lift.
Incrementality methods include holdout groups, geo tests, audience splits, and media mix modeling. Every method has tradeoffs. Match the method to campaign scale, available data, and the decisions your team needs to make.
Payback Period and Customer Lifetime Value
Campaign-end revenue can understate the value of creator-acquired customers, especially for products with repeat buying behavior.
- Payback period: The time required for gross profit from acquired customers to recover campaign investment
- Customer lifetime value (CLV or LTV): Expected revenue or gross profit from a customer during the customer relationship
A campaign with lower first-order ROI can still be valuable if creator-acquired customers return, purchase more, or stay subscribed longer. Segment customer cohorts by creator, offer, acquisition channel, and audience where data allows.
A Worked ROI Example
Take this example as a full-cost calculation:
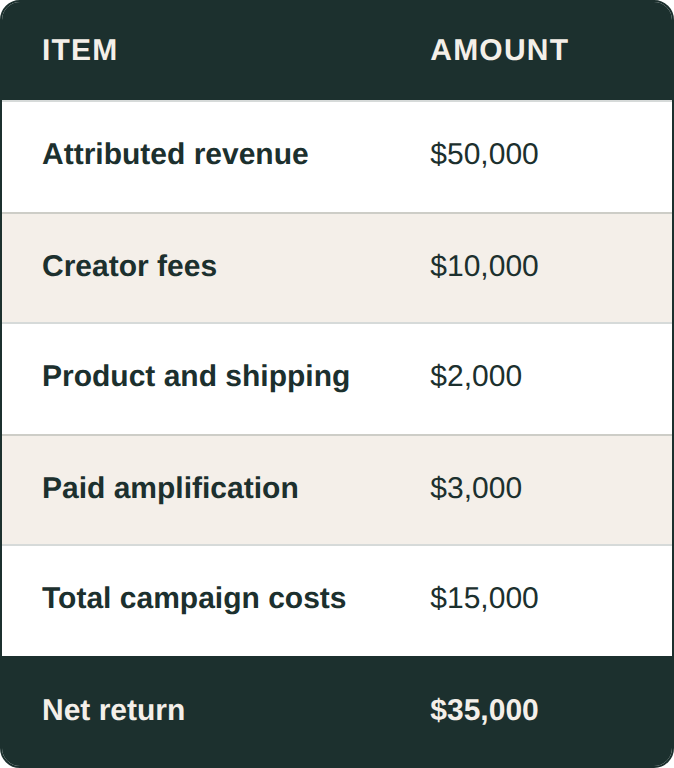
ROI calculation:
(($50,000 − $15,000) ÷ $15,000) × 100 = 233%
If margins are relevant, rerun the calculation with gross profit instead of revenue. Keep the same assumptions in each campaign spreadsheet or ROI calculator so results remain comparable over time.
Tracking and Attribution Methods That Actually Work
Influencer marketing attribution works best as a layered system. In-app browsing, cross-device buying, delayed conversions, privacy restrictions, and dark social sharing all create gaps.
Assign every creator and campaign a tracking plan before contracts are finalized.
UTM Parameters and Naming Conventions
UTM parameters identify campaign traffic in web analytics. Use a documented naming structure:
- utm_source: Platform, such as instagram, tiktok, or youtube.
- utm_medium: A consistently defined label, such as creator, influencer, or paid_creator.
- utm_campaign: Campaign name, product launch, or seasonal initiative.
- utm_content: Creator handle, asset variation, or placement.
Use lowercase values and standardized spelling. Maintain a campaign naming document so creators, agencies, paid-media teams, and analysts follow the same rules.
Create dedicated destination URLs where possible. QA every link before the post publishes. UTMs track clicks and onsite behavior well, but they cannot fully capture offline, cross-device, or unclicked-view attribution.
Promo Codes and Affiliate Links
Unique promo codes and affiliate links create a direct path to conversion tracking.
Use:
- One unique code per creator
- Short, memorable codes that fit the creator’s audience
- Clear expiration dates and offer terms
- A process for monitoring code leakage
- Attribution rules for organic, affiliate, and paid placements
Promo codes can capture a purchase when a customer buys later, uses another device, or does not click a tracked link. Code redemptions may include customers who discovered the code outside the creator’s content, so compare results with baseline demand and other tracking methods.
Pixels and Server-Side Tracking
Browser pixels track onsite events such as product views, add-to-carts, checkout starts, and purchases. Server-side tracking can improve event reliability where browser restrictions, mobile privacy settings, and consent choices limit client-side collection.
Work with analytics, ecommerce, and privacy teams to:
- Define each conversion event.
- Confirm consent practices.
- Validate purchase values and currencies.
- Set deduplication rules.
- Test events before the campaign starts.
Post-Purchase Surveys
Post-purchase surveys help identify discovery that links and codes miss, including social posts, screenshots, group chats, offline conversations, and cross-device journeys.
Use a concise question such as: “Where did you first hear about us?”
Include platform and creator options where possible, along with an open-text field. Survey results are directional, not perfectly precise. Compare self-reported creator discovery with tracked conversions to understand the likely attribution gap.
Multi-Touch Attribution in GA4
Last-click reporting often undercounts creator activity that introduces a brand before a customer returns through direct, search, email, or retargeting channels.
Multi-touch views can show assisted conversions and the broader customer path. Review:
- First-touch results
- Last-touch results
- Assisted-conversion views
- Consistent attribution windows
Document the attribution model used in stakeholder reporting. Multi-touch attribution allocates credit across touchpoints. It does not prove causation, which requires incrementality testing or modeling.
Where Tracking Breaks and How to Fix It
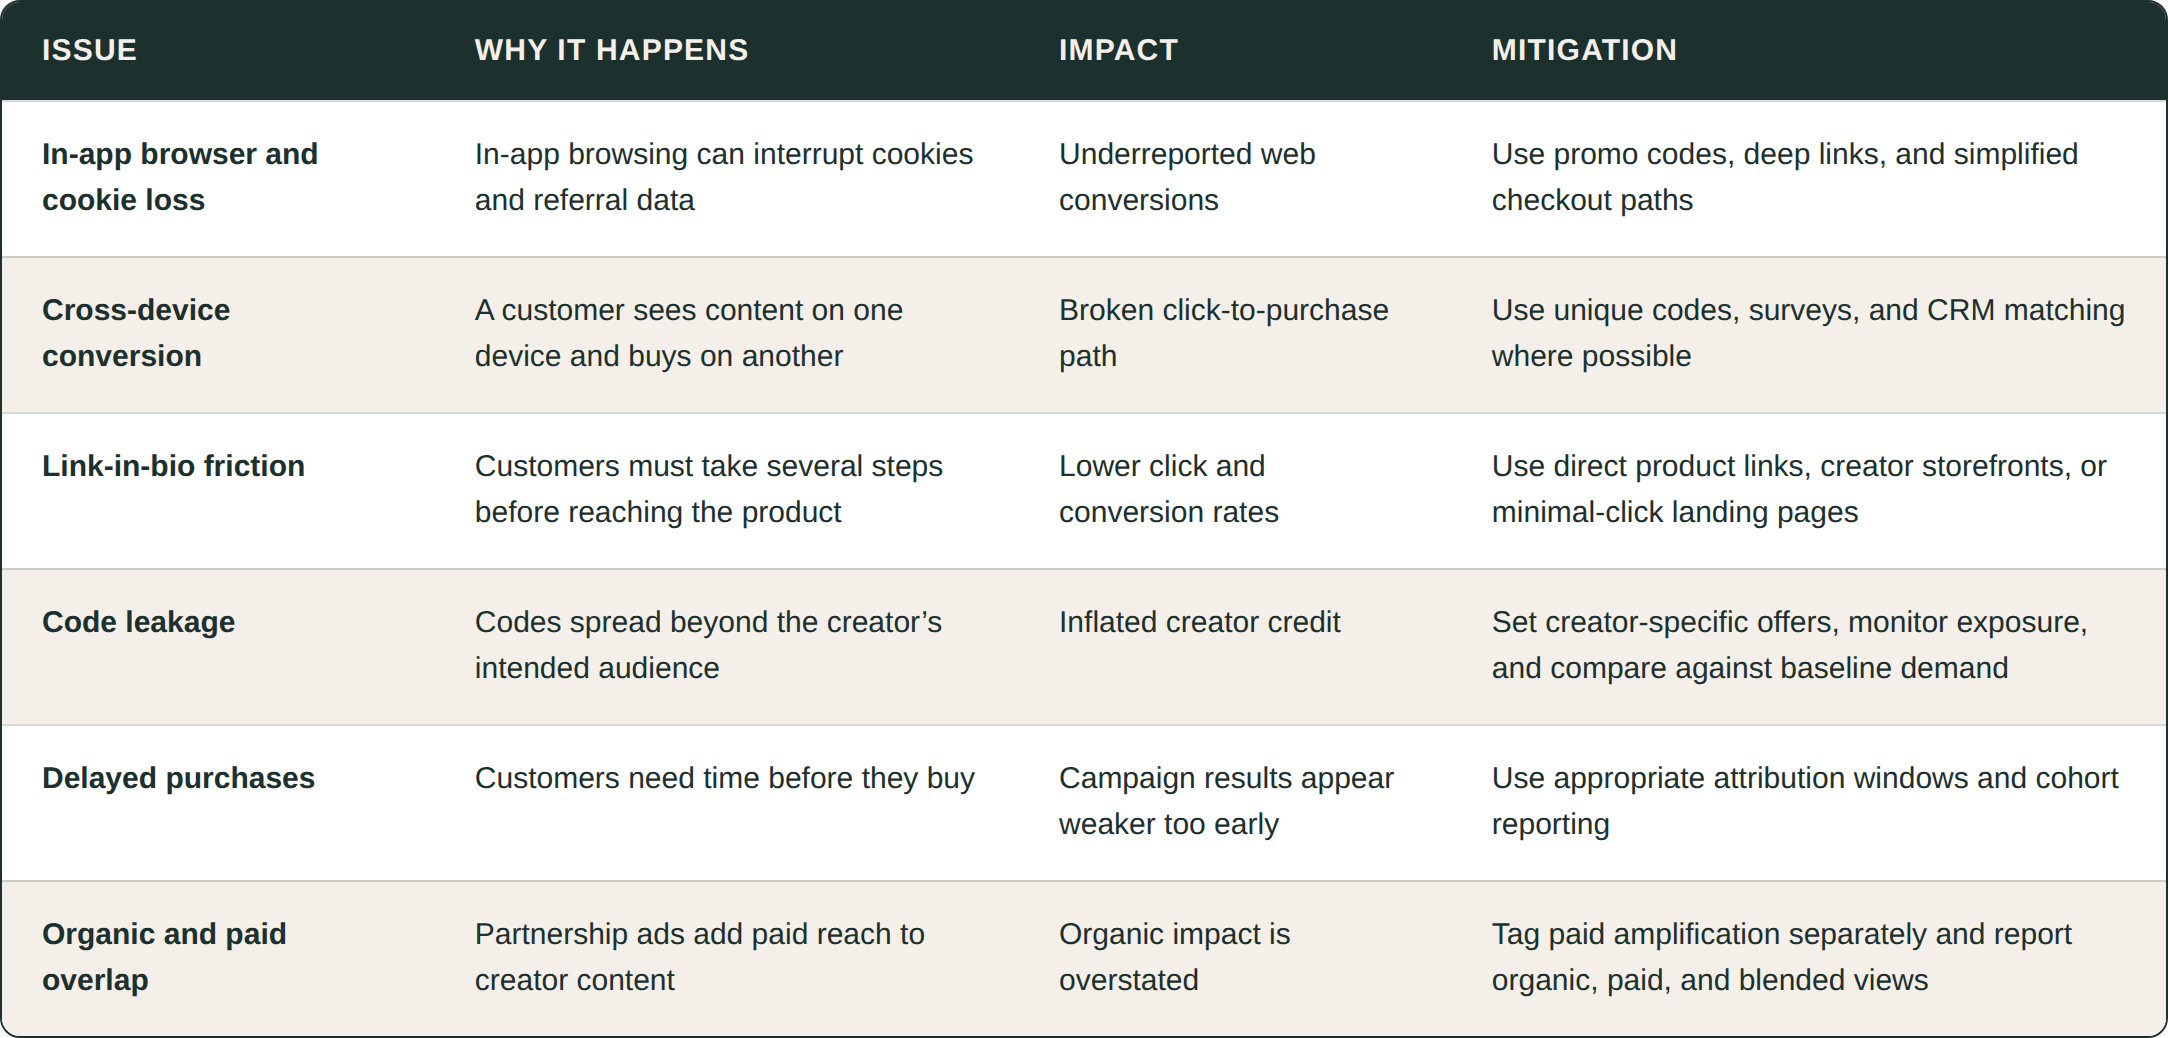
Build a Unified Reporting Dashboard
Influencer reporting should combine performance data in one view instead of relying on disconnected screenshots and spreadsheets. The dashboard should help teams reallocate budget, improve creative, select partners, and communicate results to leadership.
Build creator-level, content-level, campaign-level, and executive-summary views. Aspire’s Impact Dashboard is designed to bring cross-funnel creator program metrics into one reporting experience.
Essential Dashboard Fields
Creator-level fields
- Creator name or handle, platform, creator tier, audience segment, and content format.
- Deliverable status and publish date.
- Reach, impressions, views, engagements, engagement rate, saves, shares, and comments.
- Clicks, CTR, sessions, conversions, conversion rate, revenue, code redemptions, and new-customer rate.
- Creator cost, paid amplification spend, CPA, ROAS, and ROI.
- Qualitative notes on content themes, brand fit, and audience sentiment.
Campaign-level fields
- Campaign goal, primary KPI, benchmark, and actual performance.
- Total spend, total revenue, total conversions, blended CPA, ROAS, ROI, and estimated incremental impact where available.
- Performance by platform, creator tier, content format, audience segment, and offer.
- Top-performing creators, creative themes, and landing pages.
- Recommendations and next actions.
How to Reconcile Data Across Sources
Platform analytics, web analytics, ecommerce platforms, affiliate networks, CRM tools, and finance systems often show different totals. Each system uses its own event definitions, time windows, and attribution logic.
Set one source of truth for each category:
- Platform reporting for reach, impressions, views, and native engagement
- Web analytics for sessions and onsite behavior
- Ecommerce or CRM data for orders, revenue, new customers, and repeat purchase
- Finance data for confirmed spend and profitability
Document:
- Attribution windows
- Time zones
- Currency and tax handling
- Event definitions
- Deduplication rules
- Whether results are organic, paid, or blended
Reporting Cadence and Optimization Loops
Use a reporting rhythm that supports action.
- Pre-launch: Confirm goals, KPIs, links, codes, pixels, reporting owners, and thresholds.
- In-flight: Monitor pacing, publishing status, clicks, engagement quality, early conversion signals, and tracking issues.
- Weekly: Evaluate performance against targets. Adjust creator mix, creative direction, amplification, offers, or landing pages.
- Post-campaign: Calculate final results, document learnings, and identify repeat partners.
- Quarterly: Compare campaign cohorts, refresh benchmarks, and assess long-term customer value.
Every report should end with a decision: scale, iterate, pause, or test.
Tools for Influencer Marketing Measurement
The right measurement stack depends on campaign scale, ecommerce complexity, attribution needs, and reporting maturity. Prioritize integrations, consistent data definitions, and team adoption over adding disconnected tools.
Analytics Platforms
Web analytics tools show traffic, onsite events, and assisted-conversion activity. Dashboard tools can combine campaign, ecommerce, and platform data for faster review.
Before launch:
- Enforce UTM governance.
- Validate ecommerce event tracking.
- Confirm campaign naming conventions.
- Test creator destination URLs.
- Define who reviews and approves the data.
Ecommerce and CRM Integrations
Ecommerce and CRM integrations improve visibility into:
- Revenue and order value.
- New versus returning customers.
- Repeat purchases and retention.
- Customer lifetime value.
- Creator-acquired customer cohorts.
Plan data access and ownership early, especially when revenue data sits outside the marketing team. Marketing, ecommerce, analytics, and finance need shared definitions before reporting begins.
Paid Amplification Tracking
Boosted creator content, partnership ads, and whitelisted placements need their own measurement structure.
Report three views:
- Organic creator performance.
- Paid amplification spend and outcomes.
- Blended campaign performance.
This separation prevents paid reach and paid conversions from being credited to organic creator impact.
Choosing the Best Influencer Marketing Platform for ROI
There is no universal best influencer marketing platform for ROI. The right platform depends on campaign goals, existing systems, reporting needs, and the team’s workflow.
Use this evaluation checklist:
- Creator discovery and relationship management
- Campaign workflow and deliverable tracking
- Affiliate links, codes, and conversion attribution
- Ecommerce, CRM, and analytics integrations
- Creator-level revenue, ROAS, ROI, and cohort reporting
- Paid amplification measurement
- Configurable dashboards and exportable reporting
- Data permissions, quality controls, and support
Aspire’s influencer marketing platform supports creator discovery, relationship management, campaign workflows, affiliate programs, and ROI measurement for ecommerce brands. Evaluate the platform against your required data sources and the decisions your team needs to make each week.
Proof Points and Real Outcomes
Measurement changes campaign decisions when it links performance to a clear objective. The following examples are illustrative scenarios, not real case-study results.
How a Retail Brand Can Identify Measurable ROI
A retail brand works with a mix of smaller and larger creators for a seasonal collection. Each creator receives:
- A unique tracked link
- A creator-specific promo code
- A defined landing page
- Clear publishing and reporting requirements
The ecommerce team tracks code redemptions, linked purchases, new-customer orders, and average order value. A post-purchase survey captures shoppers who first heard about the collection through a creator but bought without clicking.
The analysis may show that creator size alone does not predict profitability. Audience fit, offer alignment, local relevance, and content format can have a stronger effect on CPA and new-customer rate.
How an Awareness Campaign Can Prove Impact
A brand launches a new product in a category where shoppers need time to learn about the use case. The campaign objective is awareness.
The team measures qualified reach, completed video views, engagement quality, share of voice, branded search, and survey-based brand lift where available. It also reviews creator comments for recurring questions and sentiment.
Direct sales may still be reported, but they should not become the main verdict when conversion was not the intended objective. The measurement plan should match the campaign brief.
How Teams Can Scale Measurement Across Campaigns
A team managing ongoing creator, affiliate, and ambassador programs standardizes creator records, UTM conventions, promo-code rules, and dashboard fields. Each new campaign starts from the same measurement template.
This reduces manual reporting work and makes it easier to compare creators, formats, offers, and platforms over time. The team can use those comparisons to allocate budget with more confidence and forecast likely performance from similar partnerships.
Start Measuring What Matters
Influencer marketing ROI becomes more defensible when measurement is designed before content publishes. Build the operating sequence into every campaign:
Goals → KPIs → tracking → reporting → optimization → long-term learning
Audit your current campaign process. Find the biggest attribution gap, whether it is missing codes, inconsistent UTMs, untracked paid amplification, incomplete cost data, or disconnected reporting. Fix that gap before the next creator post goes live.
Your 5-Step Measurement Checklist
- Define the business goal, primary KPI, diagnostic metrics, and success threshold before launch.
- Build a layered attribution plan using UTMs, creator-specific links or codes, pixels, and post-purchase surveys.
- Track full campaign investment, including creator compensation, products, production, labor, tools, and paid amplification.
- Create one reporting view that combines creator, platform, web, ecommerce, and CRM data.
- Review results on a consistent cadence and turn every report into a scale, optimize, pause, or test decision.
See Unified Reporting in Action
Aspire helps ecommerce teams connect creator activity to revenue, customer acquisition, content performance, and campaign-level ROI. Explore the Aspire Influencer Marketing Platform to see how creator relationship management, campaign workflows, affiliate tracking, and reporting can support a more consistent measurement process.
Frequently Asked Questions
How do you calculate influencer marketing ROI using the full-cost formula?
Use:
((Revenue − Total Campaign Costs) ÷ Total Campaign Costs) × 100
Total campaign costs should include creator fees, commissions, products, shipping, production, paid amplification, platform fees, and relevant internal labor. For margin-sensitive businesses, gross profit may be a more accurate return input than revenue.
What KPIs should you track for awareness vs. conversion campaigns?
Awareness campaigns should prioritize reach, impressions, video completion, share of voice, sentiment, and branded-search lift.
Conversion campaigns should prioritize purchases or leads, conversion rate, CPA, revenue, ROAS, ROI, and new-customer rate.
The primary KPI must match the campaign’s stated objective. Use supporting metrics to explain performance, not to replace the main goal.
How do you track influencer conversions when links break across devices?
Use several methods together:
- UTMs for web traffic and onsite behavior.
- Unique affiliate links and promo codes for conversion capture.
- Pixels or server-side events for onsite actions.
- Post-purchase surveys for untracked discovery.
This layered approach improves coverage. It does not eliminate attribution uncertainty, which is why teams should document their methodology and review several data sources together.
What is earned media value, and when should you use it?
Earned media value, or EMV, estimates what comparable exposure or engagement might cost through paid media. It can support directional comparisons and awareness reporting.
EMV should not replace revenue, profit, ROI, or incrementality when the goal is to measure business impact.
What influencer engagement rate benchmark should you use?
There is no universal engagement-rate benchmark. Engagement varies by platform, content format, audience size, industry, and creator-audience fit.
Benchmark each creator against their own historical performance and against comparable creators in the same campaign.
Engagement rate by followers = (Total engagements ÷ follower count) × 100
Engagement rate by views = (Total engagements ÷ total views) × 100
Engagement by views is often more meaningful for video-led campaigns because it measures interactions among people who received the content.